Introduction 👋
Hi dear developers! Christmas is coming and I have a gift for you 🎁 :)
My name is Alexey. I'm a software developer and I'm building a tool that I hope you'll find helpful. In this article, I want to explain what made me start working on it and why I think you need it.
Problems and Prior Art solutions
JavaScript ecosystem is thriving. For every problem, we have many existing solutions in the form of npm packages - we reached 1 million packages milestone in 2019. That is a sign that the ecosystem is alive and continues to advance. Every coming library fuels developers' imagination to create new even better solutions - faster, with better UX and DX, with more features.
On the other hand, it creates the problem of choice, we need to choose the right solution, the best library. What tech stack to use when building an evergreen project? Which package to use to replace the legacy one? Or maybe you have already chosen one, but need to convince your team that it's the best one.
One approach
Every year tons of new articles are written trying to help developers to pick the right library or framework.

Also, many surveys are conducted trying to solve the problem. Some of the well-known surveys are StateOfJS and Stack Overflow Annual Developer Survey.
Those articles and surveys themselves create a new problem - which article/survey to trust, which one is up to date, the most objective and comprehensive.
Another approach
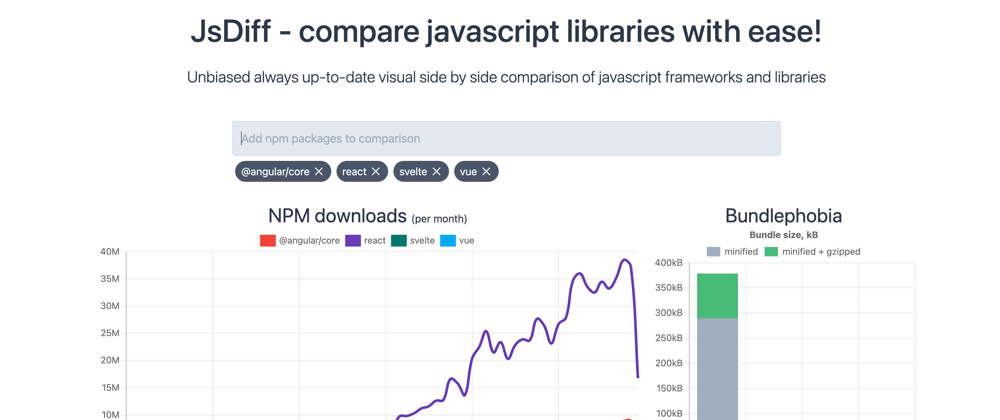
Developers can also do their own investigation and get factual up-to-date information themselves. For example, one can go to Npm Trends and compare how popular the libraries are in terms of npm downloads. Bundlephobia can be used to check the bundle filesize. Github can provide information related to popularity, issues, commits frequency, etc. Many other services exist to provide different kinds of metrics.
The problem here is to know the metrics, know which services to use to get the data, combine the results, and get the answer. It's not easy at all.
Solution 💡
I decided to alleviate the problem and create a tool to help us, developers, get the factual data and easily compare javascript libraries side by side using graphs and charts.
Meet Moiva.io! 👋👋👋

Features 🪝
Here is the list of main selling points:
- data about any npm package
- different sources of data, like (NPM, Github, Bundlephobia, Google Trends, Thoughtworkds Tech Radar)
- side by side comparison of any number of libraries using charts and graphs
Upcoming Features 🔥
Here are the ideas that I have at the moment:
-
alternatives autosuggestion. For example, when one selects
MomentJS, the tool auto-suggestsdate-fnsanddayjsto compare it with. Similar to what NpmTrends already does
- more metrics for comparison such as salaries per technology 💰, commits frequency, vulnerabilities 🐛, real usage on websites.
- use of data from popular surveys
- UX improvements
Feedback is a gift
The project is at an early age, so any kind of feedback is very important for it to become the right tool that solves the real problems of real people. So please share your opinion
2020-12-17 Update
I addressed one of the popular feedbacks and renamed the project to Moiva.io. I made corrections to the post to reflect that change.


Top comments (22)
Hi this is nice idea. 😄 , But are the data accurate ?
Angular:
Jsdiff Github Stars: 59587
jsdiff.dev/?compare=angular -
Github Stars: 68.7 k
github.com/angular/angular
?
Hi Shaiju,
Thanks for the question!
The information is correct, it's just confusing naming of Angular's npm packages.
It's the old AngularJS (
angularnpm package) which has 59587 stars - github.com/angular/angular.js/The latest Angular framework (which has 68.7 k stars) is exposed as
@angular/corenpm packagemoiva.io/?compare=%40angular%2Fcor...
I will later provide more details so that it'll be easy to validate data and get more information
Nice , It will be useful if you can provide tag options to select top JS frameworks as options like angular, react, vue. So users can select each tag to search faster instead of typing.
Also you can show in sidebar top trending JS framework by day, week , month and year.
Nice idea, thanks! 👍 I noted it down.
Another idea that I mentioned in the "Upcoming features" section is "alternatives autosuggestion", it should also help to some extent to select libraries for comparison
Also change the repo text, currently it says : A repo for jsstats.com issues
Oh, right! Thanks for noticing it! I fixed it now.
I thought I cleaned it and fixed it everywhere :)
Love your idea. I always visit a few websites and sort of compile this data myself when looking for a library.
In my opinion 2 most important things:
I) Add autosuggestion as you have planned and do the autosuggestions RIGHT. I don't mean any fancy AI model, just autosuggestion of the most POPULAR ALTERNATIVES. That's whats missing for me in npmtrends and would be a good reason on itself for me to switch to JsDiff.
Because the biggest issue with npm is there are hundreds of libraries named reasonably yet being not used at all or just being complete bullcrap...
II) You should prioritize like this: |accuracy of data| = |UX| > |number of data sources compiled on the website|.
It's a 'at one glance' tool. I'd say it can really only by done by trial and error (or surveys...).
The metrics I find the most important are:
1) npm downloads (that you have) - social proof
2) github stars (must be somewhere at the top!) - social proof
3) date of recent commit - is the project maintained
4) number of contributors - will the project be maintained, is there a community or is it a one-man band's work
5) features - not something you can put on a chart though ;-)
6) variety of metrics: issues, issues resolved ratio, date created, size, commits/PRs trends (how actively does a project grow, it's actually missing from npmtrends),
As to what you already have:
Damn, I am so opinionated ;-)
I've added it to bookmarks, though, and keep fingers crossed for you making a great tool! :-)
@zarehba I love your thoughtful feedback and very-very much grateful to you for that! 🙏
Agree with everything!
tablepackage. What will the chart show for the keywordtable? I guess it won't reflect trends for thetablepackage 😃 So it needs some thoughts how to improve it. I think the problem with peeks and lows exists mostly in case of not very popular packages. Popular packages should have more stable graphs. Unfortunately Google Trends doesn't provide a real API to adjust the data, so my abilities are also limited here. Anyway, I'll definitely think about what I can improveThanks a lot for your other notes about metrics and their priority.
Very much valuable feedback 👍 I'll come back to it and make sure I haven't missed anything.
About the gray color - the website would be easier to read when, say, in your example, the bars pertaining to angular would be red on every chart, react ones purple etc.
Yeah, I feel your pain about Google Trends..
Keep up the good work ;-)
That's awesome, did you know about npms.io? It's currently my goto resource when trying to understand my options.
Maybe there is a way to integrate their metrics? (As far as I know they are called the same as on npm but are working quite differently.)
Hi Christian,
I use npms.io for suggestions and in some other use case. I know that Bundlephobia uses it as well.
Unfortunately, it seems I can't rely on that service for several reasons:
Having said that, I'm migrating to "native" npmjs api
This is great. Im going to use it on this article blog.bearer.sh/top-node-request-li... and see what it comes up with. Need to find an alternative to Axios and the now dead request.
Very cool! If you want to add in State of JS data in there we also have a public GraphQL API: graphiql.stateofjs.com/
Oh wow!!! That's really cool, you are awesome guys!
It simplifies my life 😀
BTW, looking forward to the results of StateOfJS 2020 survey!
Very nice :-)
Bundlephobia shows some useful metrics - Is it tree-shakeable? side-effect free? how many dependencies?
I also look at what languages are in the codebase, and whether there are tests.
Agree about dependencies!
I'll also check what can be done regarding tree-shakeability.
Thanks for the suggestions! 👍
What a nifty idea! Thanks for making this 😍
Have you put this on GitHub?
Nice idea. Looks promising!
Thanks Rob!
I got feedback that the project's name is confusing.
I agree with that to some extent :)
I'm open to your suggestions, folks.
Let's come up with a simple and catchy name! 🤘
What kind of metrics and resources do you usually use when comparing javascript libraries?
What kind of charts and graphs would be helpful to you?