
- The Comfort Zone
- Leveling Up Our Console Game
- Replacing Logging with Live Expressions
- Using the Console to Manipulate the Current Document
- Moving from Console to Sources
- Power Tip: Navigating Developer Tools Faster with the Command Menu
- Sync Your Development and Debugging Tasks with Workspaces
- Merging Developer Tools with the Editor: the Devtools for VS Code Extension
- What’s Next?
- Frequently Asked Questions (FAQs) about Debugging Skills in JavaScript
You may have established a pattern of coding that utilizes a few key tools offered by your browser’s console. But have you dug any deeper lately? There are some powerful tools available to you, and they might just revolutionize the way you work.
The Comfort Zone
As developers, we like to find a way of working that make us feel efficient. The trap, though, is that we get comfortable with a certain workflow and assume there’s no better way. We’ve internalized an approach and don’t have to think about what we do.
A common developer workflow is to write code in an editor, save it, then switch to the browser and load the product to see if everything works. We then use the developer tools in the browser to tweak the CSS and maybe test how the products react to resizing and mobile emulation. We debug our scripts by adding a console.log() statement wherever we need some insights — keeping a tight connection between line numbers and debugging.
This results in a bit of a mess. If you keep your browser tools open when surfing the Web, you’ll see a lot of messages in the code that shouldn’t end up in a final product. It not only makes it confusing for people who open them by accident, but can also be daunting for new developers to look at.
We only use a small percentage of the tools at our disposal, and we may miss out on opportunities to work better and with less effort. That’s okay, but let’s see how we can do better.
We’ll look at a few features of freely available developer tools you probably use but don’t know about. Specifically, these features are in the Chromium browser developer tools and some in Visual Studio Code. Let’s start by learning more about a perennial favorite — the Console.
Leveling Up Our Console Game
We’re conditioned early on in our development career to add a console.log(thing) anywhere in our code to learn about what’s going on. Often that’s enough, but sometimes you still don’t get the right information, or it’s in some raw format that’s hard to understand.
You can see all the following tricks by grabbing this demo page on GitHub and opening it in your browser with your developer tools open. (Or view a live demo on CodePen).
The first trick here is to add curly braces to variables you log. This not only prints out their value, but also the name of the variable. It makes it easier to track down in the log what value came from where.
let x = 2;
console.log(x) // 2
console.log({x}) // {x: 2}
Formatting logs
You can also use specifiers in your log message which start with a percentage sign. These allow you to log certain values in different formats:
%s: logs as strings%ior%d: logs as integers%f: logs as floating-point value%o: logs as an expandable DOM element%O: logs as an expandable JavaScript object
You can mix and match those. The order of replacement in the first string is the parameter order following it:
console.log('%ix %s developer', 10, 'console');
// 10x console developer
You can even convert with this, in case you get information that isn’t in a format you like:
console.log('%i', 12.34455241234324234); // 12
The %c specifier allows you use CSS to style your log message in case you really want to stand out:
console.log('%cPay attention to me','color:firebrick;font-size:40px')
Logging is great, but there are more options you can use to make things more obvious and to avoid having to write functionality yourself.
Grouping logs
You can group your logs using console.group() to show them as expandable and collapsible groups.
const label = 'The Millenium Falcon Crew';
console.group(label);
console.log('Leia');
console.log('Han');
console.log('Chewie');
console.log('Ben');
console.groupEnd(label);
You can nest groups, and you can use console.groupCollapsed() to not expand them by default:
const extendedlabel = 'The Millenium Falcon Crew extended';
const meat = 'Humanoids';
const metal = 'Droids';
console.group(extendedlabel);
console.groupCollapsed(meat);
console.log('Leia');
console.log('Han');
console.log('Chewie');
console.log('Ben');
console.groupEnd(meat);
console.group(metal);
console.log('R2D2');
console.log('C3PO');
console.groupEnd(metal);
console.groupEnd(extendedlabel);
Allow for log filtering
Instead of console.log() you can also use console.info(), console.error() and console.warn(). This allows you to filter the messages you see in the console using the console sidebar or the levels selector. That way, you make it easier to find your own messages amongst those coming from third-party scripts and other scripts in you project.
Other useful console methods
You’ve probably created variables in your debugging journey that count how often a certain method was called or functionality executed. You can do the same thing by using the console.count() and console.countReset() methods. You can create as many of them as you want and distinguish by label:
console.count('Chocula'); // Chocula: 1
console.count(); // default: 1
console.count('Chocula'); // Chocula: 2
console.countReset('Chocula');
console.count(); // default: 2
console.count(); // default: 3
console.count('Chocula'); // Chocula: 1
You can also measure how long a certain part of your script takes using the console.time() method:
console.time('go');
for(let i = 0; i < 200000; i+=1) {
  let x = Math.random()*2000;
}
console.timeEnd('go'); // go: 11.7861328125 ms
Depending on the data you want to log, it also makes sense to use the right method for the job. Using console.dir() displays not only the content but also the type of data you send it. If you want an XML representation of a node, for example, you can use console.dirxml(). And console.table() is excellent for showing JSON data as a sortable table.
Replacing Logging with Live Expressions
It’s tempting to use console.log() to monitor things that change a lot. This isn’t only slow, but also pretty tough to follow. While it’s useful that the console automatically groups similar values as instances, it’s still a lot of movement, and you often find yourself only wanting to check the value instead of scrolling back to see where a certain change happened.
This is where live expressions come in. You can add live expressions by activating the eye button in the developer tools. You’re then asked to enter any valid JavaScript expression, and its value will show up above the console.
Try it out by activating the eye button and entering document.activeElement. The expression should show body as a value until you activate or focus on any other element in the page. You can see it in action on the SitePoint website in the following video:
Each expression has an x button next to it to stop monitoring the value. Live expressions are persistent and not connected to a certain domain or site. That’s why it makes sense to remove them after you’ve finished debugging to avoid errors.
Live expressions are wonderful little helpers to monitor changes in the data of your scripts without having to use the console. This is especially useful when you log very busy values — such as the mouse position. This is probably how you’d approach that:
let x = 0;
let y = 0;
document.addEventListener('mousemove', e => {
  x = e.x;
  y = e.y;
  console.log({x}, {y});
});
The result is a really busy log, and it’s easy to miss important information. Using live expressions, you don’t have to grasp a fast-moving log, which most likely is also a faster debugging experience. You can see the difference in the following video.
Try it out yourself: grab the demo code for moving the mouse with logging and moving the mouse without logging and try running both examples in the browser.
Using the Console to Manipulate the Current Document
The Console in the developer tools is so much more than a way to display a log. It’s a REPL that allows you to write and execute JavaScript and learn about available methods and properties of the current document using autocomplete. Just go to the Console in the developer tools, type doc, and hit tab, and it will automatically convert it to document. If you add a full stop, you’ll see all the available methods and properties. This is an engaging and simple way to learn about available methods and properties, and it allows you to write a lot of code in a short amount of time.
In addition to that, the Console is also an excellent way to interact with the current document and access parts of it. There’s a large number of convenience methods and shortcuts available to you as Console Utilities. Some of these are:
$_stores the result of the last command. So if you were to type2+2and hit enter, typing$_will give you 4.$0to$4is a stack of the last inspected elements, where$0is always the newest one.$()and$$()are short fordocument.querySelector()anddocument.querySelectorAll().$x()allows you to select DOM elements by XPATH.copy()copies whatever you give it to the clipboard.clear()clears the console.getEventListeners(node)lists all the event listeners of a node.monitorEvents(node, events)monitors and logs the events that happen on a node.monitor(method)creates a log item whenever a method is called.
Some of these methods are incredibly powerful and are things we probably have written ourselves as a series of console.log() statements in the past.
Here are some ways you can use these methods:
monitorEvents(window, ['resize', 'scroll']);

monitorEvents($0, 'key');
This logs every time the window scrolls or gets resized. The second example is interesting, as it logs any key action on the currently selected element:
console.table($$('a'),['href','text'])
This retrieves all the links in the document (as $$('a') is short for document.querySelectorAll('a')) and displays them as a sortable table. The array as a second parameter of the table method defines the columns of the table. Otherwise, each property of the link would become a column and that’s hard to navigate. The fun bit is that the table is not only sortable, but you can copy and paste it — for example, into Excel.
Instead of writing complex JavaScript to filter these results, you can use the power of CSS selectors. For example, if you want to have a table of the src and alt information of all images in the document that aren’t inline images, you can use the following:
console.table($$('img:not([src^=data])'), ['src','alt'])
However, the most fun with this is to write scripts that run in the context of the page.
For example, when you use Markdown to generate HTML, most page generators will create automatic IDs on headings to allow for deep linking to that part of the document. A # New Stuff heading will turn into <h1 id="new-stuff">New stuff</h1>. I needed to batch-create a lot of short URLs pointing to these deep links and didn’t want to create them by hand.
So I started to write a script for the Console to do that for me:
let out = '';
$$('#main [id]').filter(
    elm => {return elm.nodeName.startsWith('H')}
).forEach(elm => {
   out += `${elm.innerText}
${document.location.href}#${elm.id}
`
});
copy(out);
The result is a block of text with the text content of each heading followed by the full URL pointing to it.
This also shows an interesting extra feature of the $$ shortcut. A document.querySelectorAll('#main [id]').filter() would result in an error, as the returned value isn’t an Array but a NodeList. You’d need to cast it to an Array with [...document.querySelectoAll('#main [id]').filter()] or Array.from(document.querySelectoAll('#main [id]').filter()), which has been an annoyance for people coming from jQuery to JavaScript for quite a while. The $$ convenience method allows for all the Array methods directly.
Generally, you have a lot of power to access and change anything on the rendered page in the browser from the Console. And you also have the added benefit of using the Elements tab of the developer tools to get the correct path. Activate the ... menu next to each node and select from the context menu’s copy menu to grab what you need.
Moving from Console to Sources
Once you’ve found some fun ways to manipulate web sites, you’ll soon run into the limitations of the Console as a script environment. It can be a bit tough to code on the Console, as you’re working in a single-line environment. Hitting Enter immediately executes what you typed and often you do that by accident. There’s a trick, though. You can write multi-line scripts by using Shift + Enter instead.
In general, the Console makes for a great testing environment but for a poor editing experience. Luckily enough, there’s also a full editor available in the Sources panel. There, you can inspect the code of the current page and write more complex scripts to interact with it.
Power Tip: Navigating Developer Tools Faster with the Command Menu
Finding a certain tool in the browser’s developer tools can be daunting, as there are so many available. The tools have grown organically over the years, and many of the specialist sections may never be for you, while other people rely on them.
Rather than having to go through several menus to find what you need, there’s a handy shortcut, the Command Menu.
You can access the command menu by pressing Control + Shift + P (Windows, Linux) or Command + Shift + P (macOS). Or choose the “Customize And Control DevTools” (… or ⋮) menu (top right of the DevTools window) and then choose Run Command.
Either way, you get a menu that allows you to access all of the devtools functionality by keyboard, which often means a much faster and direct way. As hinted in the name, you can also trigger functionality with this menu.
Snippets
Snippets are an excellent way to keep scripts you write that interact with a document. They’re small scripts that have access to both the currently open browser document and the convenience methods of the Console.
Try it out right now by hitting the Command Menu keyboard shortcut, typing snip and hitting Enter, effectively telling the Developer Tools to create a new snippet. This gets you to the Snippets editor, and it will have created a new snippet with a generic name. Open the context menu on the file name of the Snippet on the left, select rename and call it Get all links, as shown in this GIF:
On the right, you have a full-fledged editor with color coding, autocompletion, multiple cursors and all the other things you expect these days. You can start writing your script. How about writing a script that gets all the links and their text (or equivalents) from the current document? We should also flag up which ones surround images and print out an error message with a list of all those that that don’t have any text. These should also get a red border so we can see the issue.
Here’s the script. It uses quite a few of the things we looked at earlier. Copy and paste it into the snippets editor:
console.clear();
let out = '';
let problems = [];
$$('a').forEach(a => {
  let text = a.innerText.trim();
  let prefix = '';
  if (!text) {
    if (a.querySelector('img')){
      text = a.querySelector('img').alt;
      prefix = 'Image: ';
    }
    if (a.getAttribute('aria-label')) {
      text = a.getAttribute('aria-label');
      prefix = 'Aria Label: ';
    }
    if (a.getAttribute('aria-labelledby')) {
      text = $('#' + a.getAttribute('aria-labelledby')).innerText;
      prefix = 'Aria Labelled By: ';
    }
  }
  if (text) {
    text = prefix + text
  } else {
    a.style.border = '1px solid firebrick';
    problems.push(a);
  }
  out += `
${text||'No Link text'}
${a.href}`;
});
if (out === '') {
  console.warn('Sorry, no links found');
} else {
  copy(out);
  console.info('done harvesting links, ready to paste');
  if (problems.length > 0) {
    console.warn('There were %d issues:', problems.length);
    console.groupCollapsed('Links without text');
    problems.forEach(a => {console.dirxml(a)});
    console.groupEnd('Links without text');
  }
}
Once you’ve pasted new content or edited a snippet, you’ll see that the file name on the tab above and in the list on the left has an asterisk. This means it’s an unsaved file. To store it on your computer, press CMD + s on macOS and Ctrl + s on Windows/Linux. You run the snippet in the editor by activating the play button below or hitting CMD + Enter on macOS and Ctrl + Enter on Windows/Linux.
The following GIF shows the script running on the What’s New in DevTools 89 document:
You can create as many snippets as you want, and they’re not connected to a certain URL or document. You can run them against any web content you want.
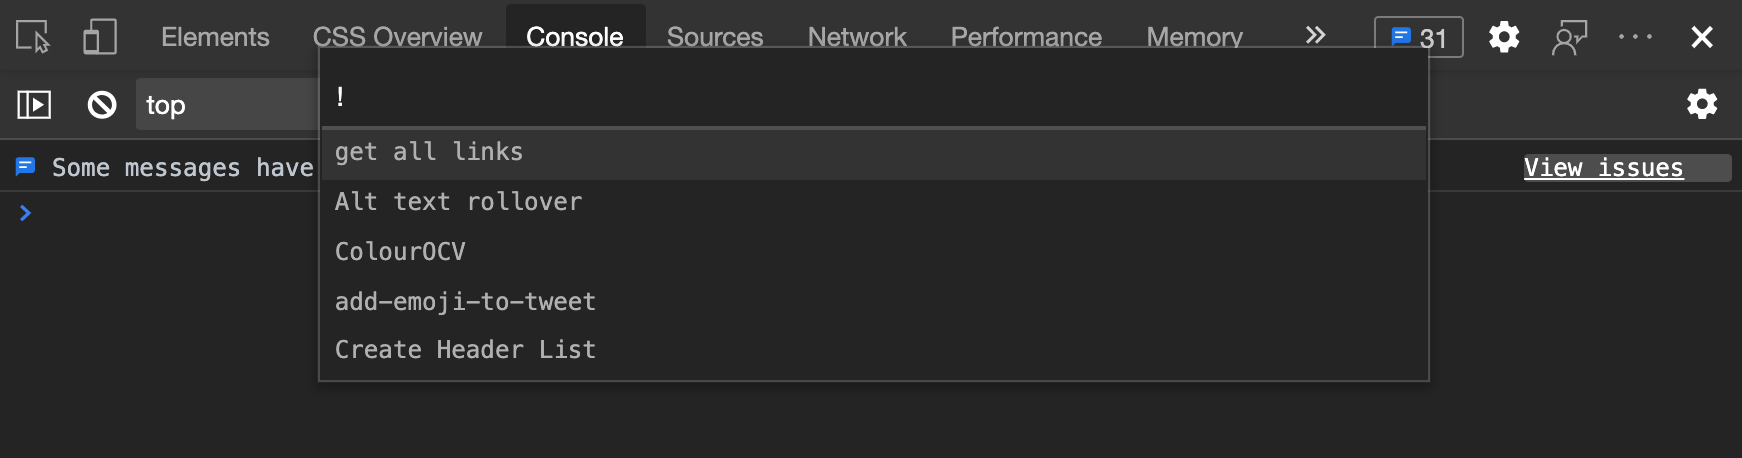
One really nice feature of Snippets is that you don’t need to go into the editor to run them. Once you’ve saved them on your device, you can also reach them from the Command Menu. All you need to do is to delete the > and replace it with an !. This gives you an autocomplete menu with all the snippets on the computer. Start typing the one you want to run and hit Enter.
That way, you can quickly access all of you snippets to run against the current website. All by typing ! followed by the name of the snippet.
In my case, this looks like this:
Snippets are great if you want to manually run a script to manipulate the current document. But what if you want to automatically run a script or change something in a website every time it loads? Read on.
Overrides
Overrides are local copies of remote files. Instead of always loading the file from the server, the browser’s developer tools interject and replace the files with your local copy. This is incredibly useful if you want, for example, to edit a full style sheet of a complex website without building it locally or waiting for deployment to finish. It’s also a great way to find performance problems by serving files that are slow to load from you hard drive during development.
You get started with Overrides by setting up a folder on your local hard drive. In my case, I created a folder called local-overrides in my Downloads folder.
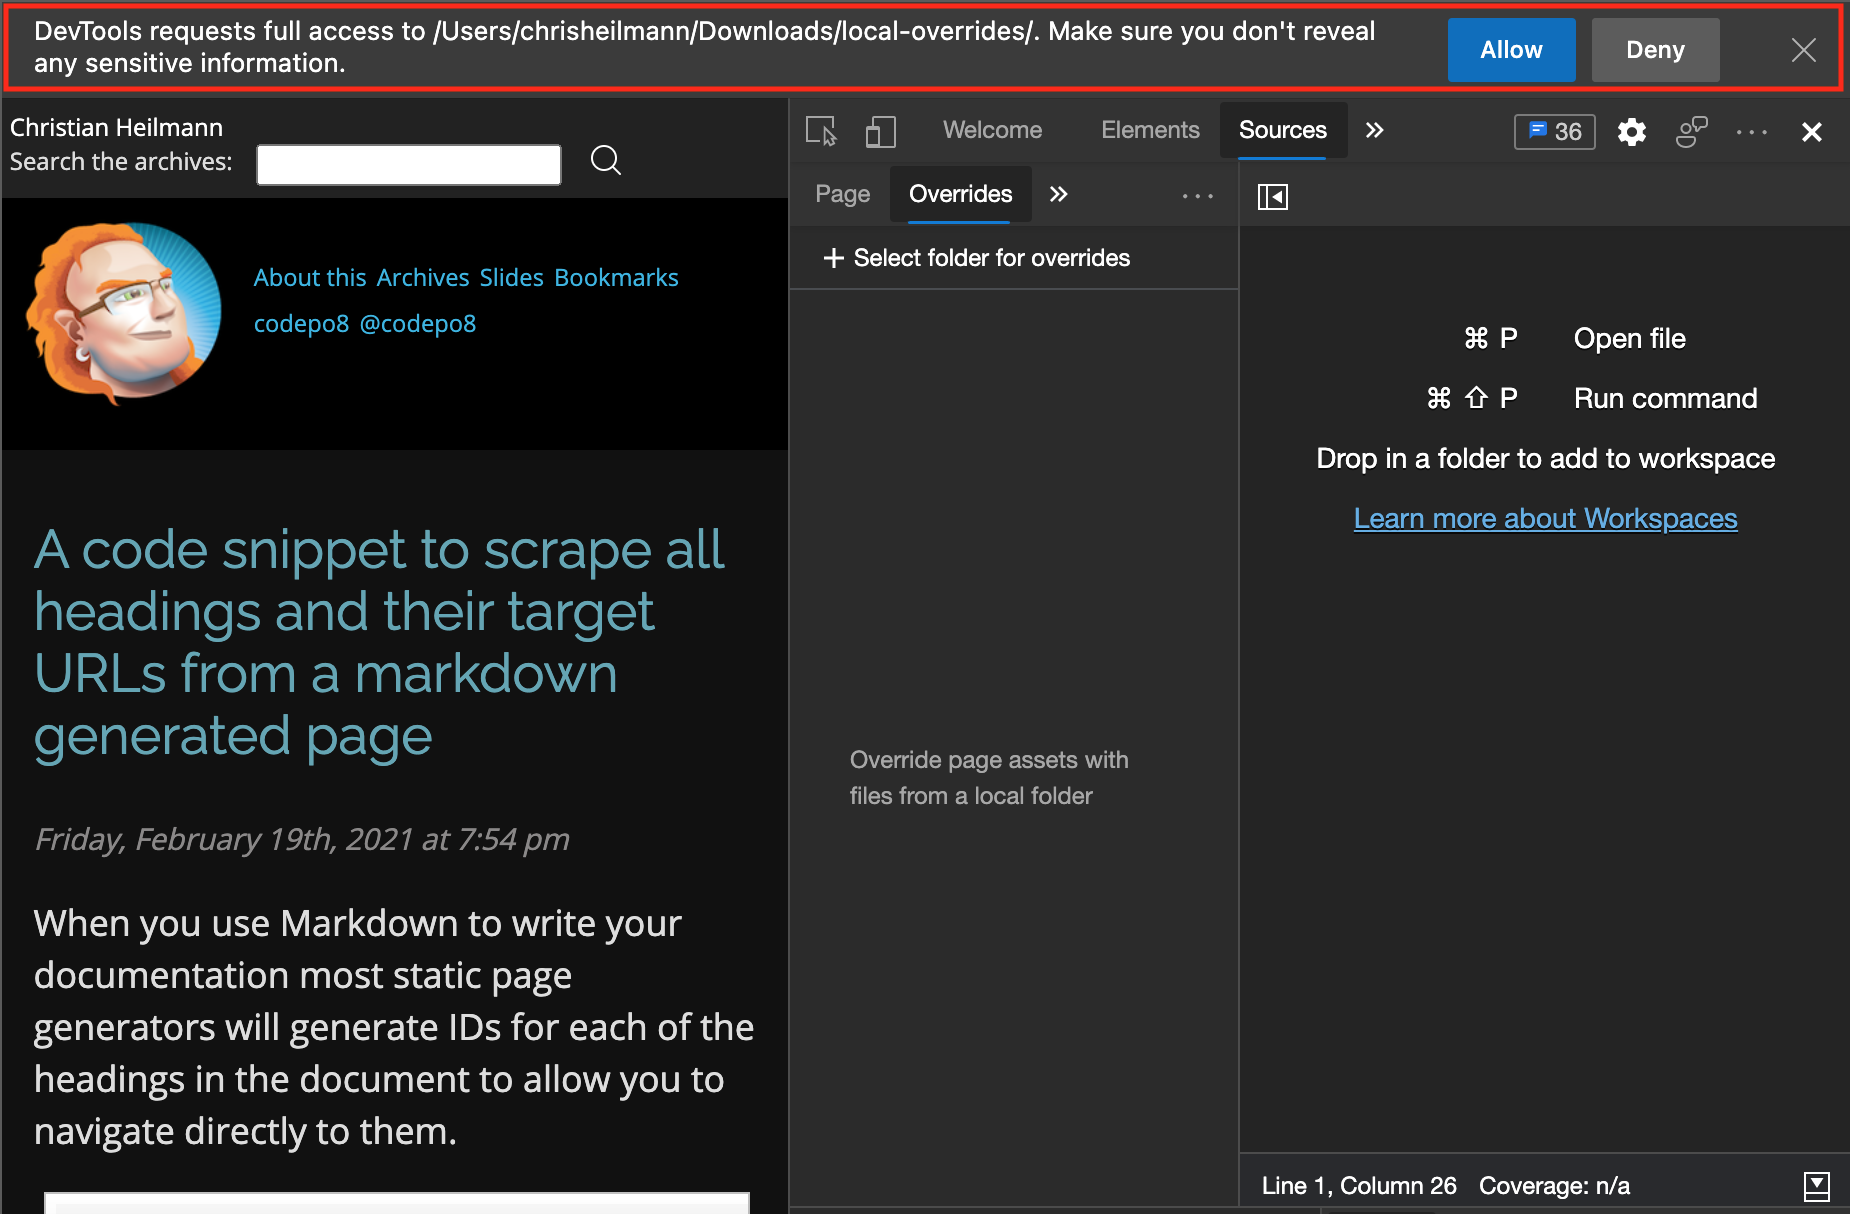
As an example, if you now wanted to inject some JavaScript into my blog, you’d need to navigate to the Sources tab in developer tools and select the Overides tab in the bottom menu.
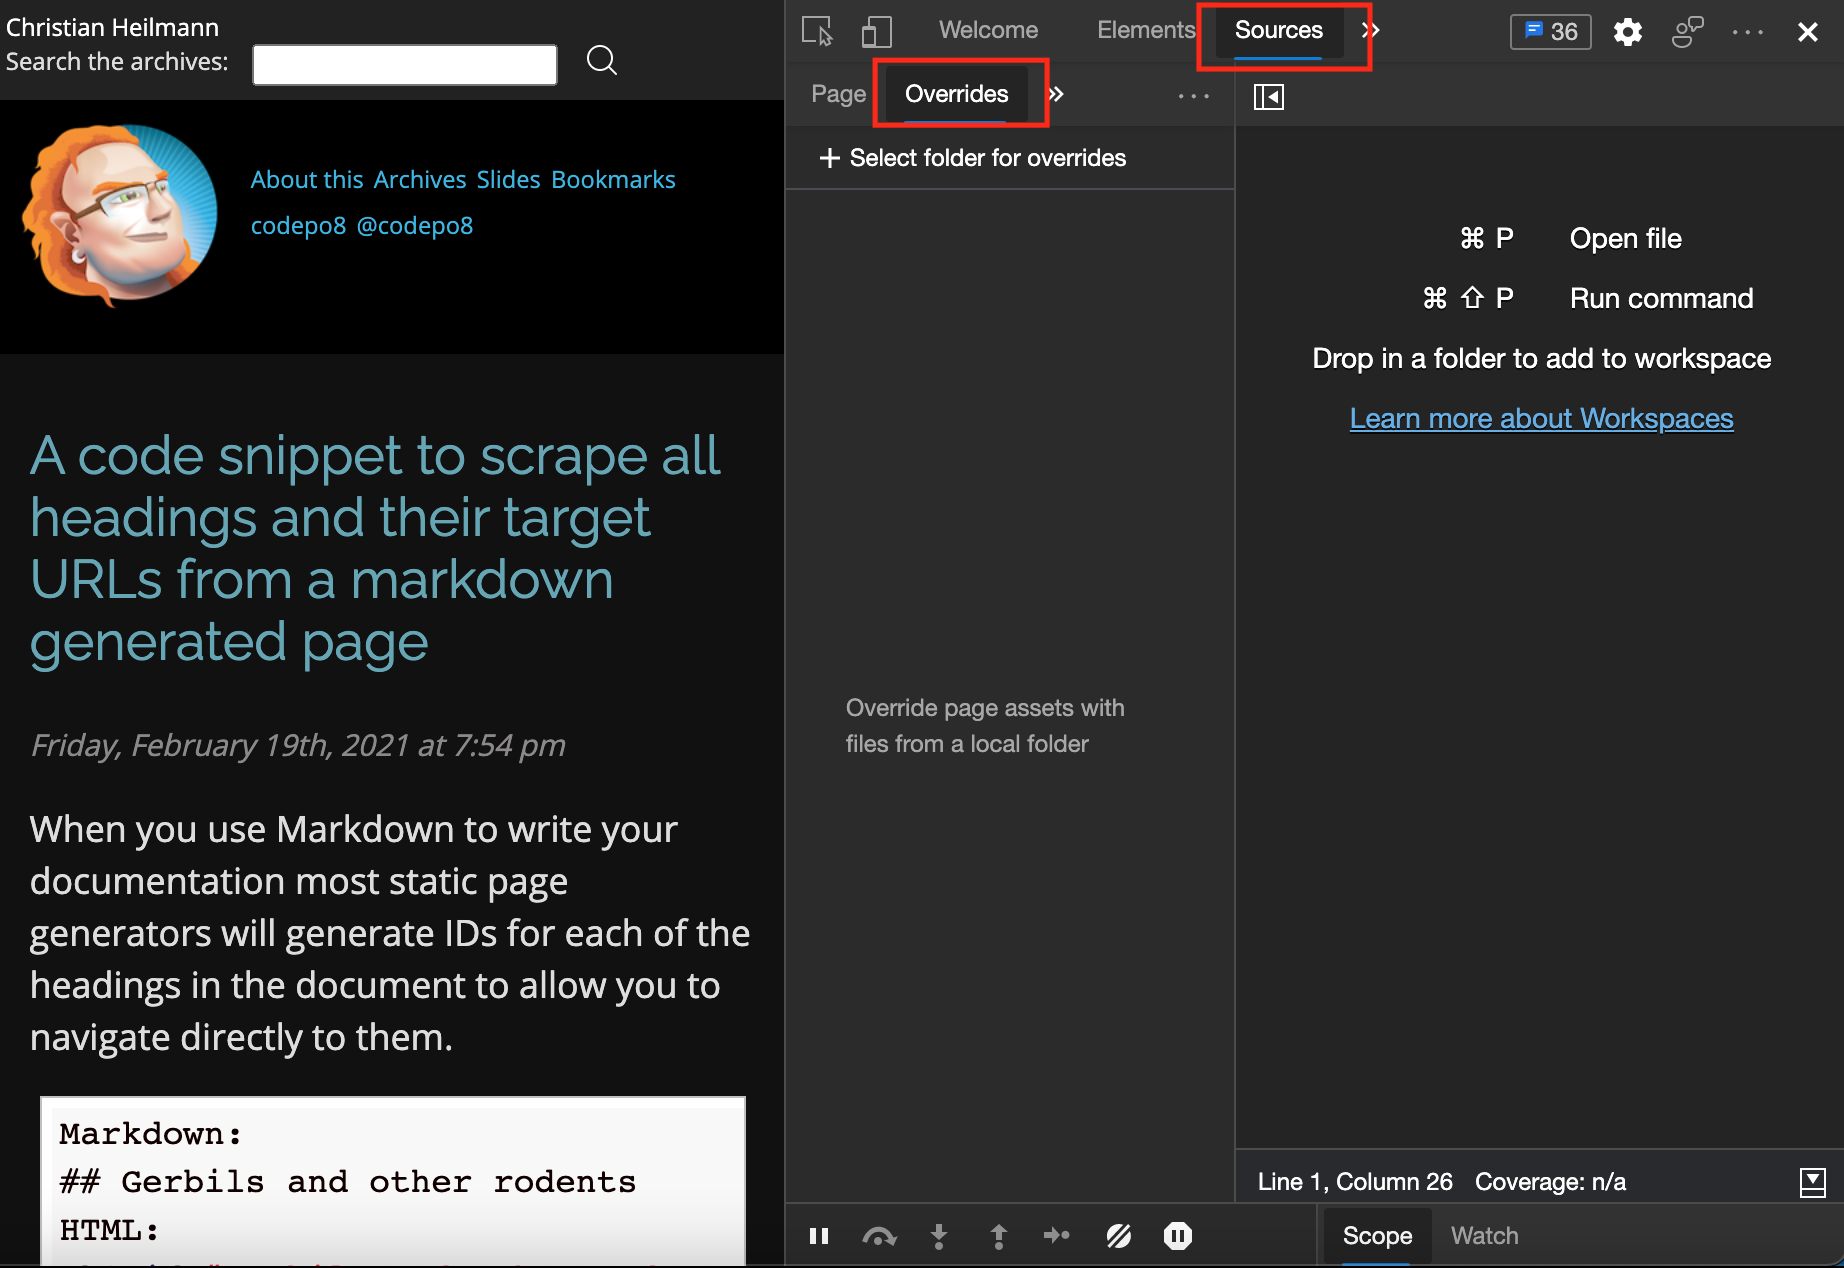
Below, you can find a + Select folder for overides button. Activating this one will prompt you to select a folder on your hard drive to store files in.
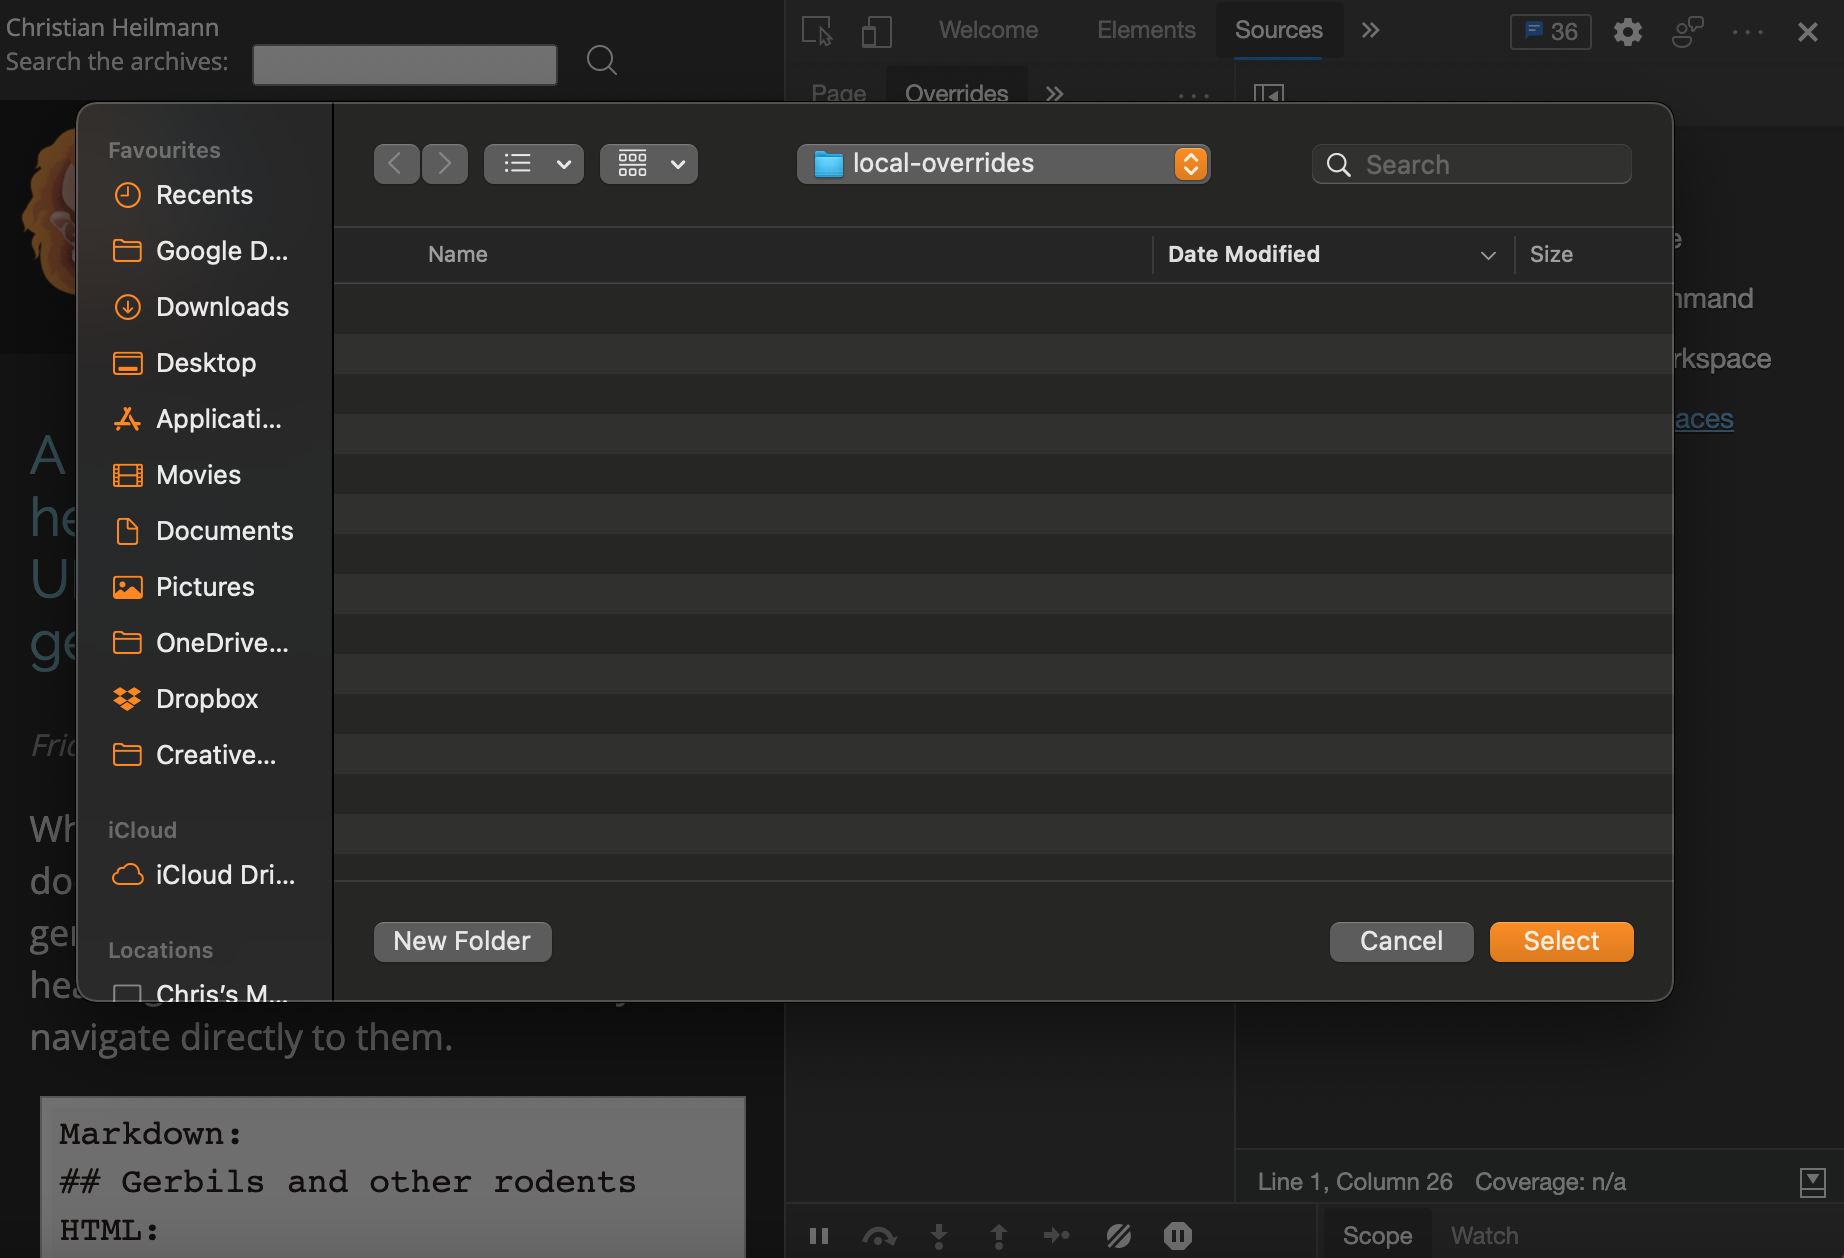
As developer tools will need to store information there, you get asked to give permission to do so by activating the Accept button.
Once that’s done, the local overrides folder appears below. Above is a checkbox to toggle overrides. This is handy, because it means you don’t need to delete the folder or scripts all the time. You can uncheck this option and the browser will load resources from the Web again. The button with the circular icon next to the option deletes all overrides.
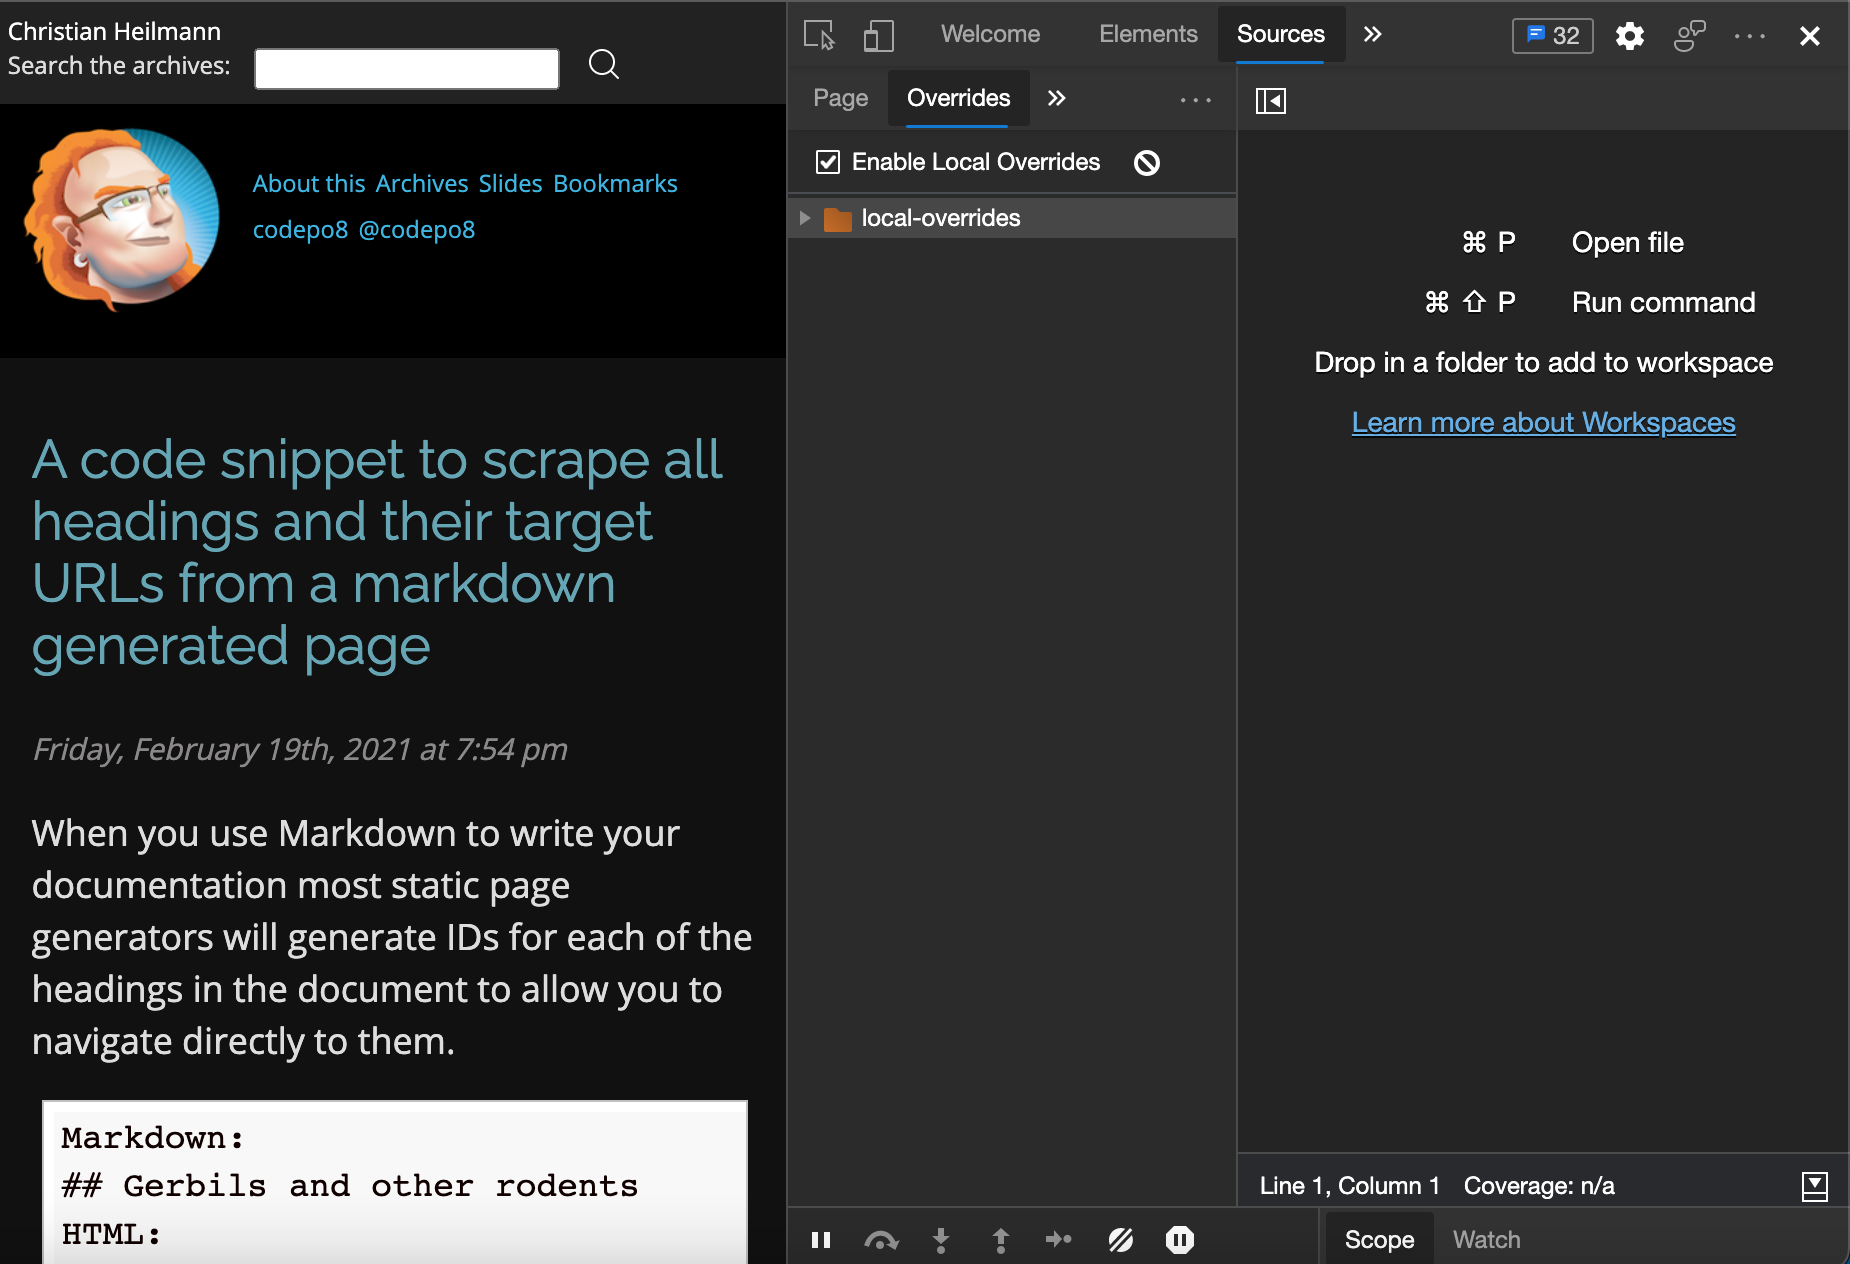
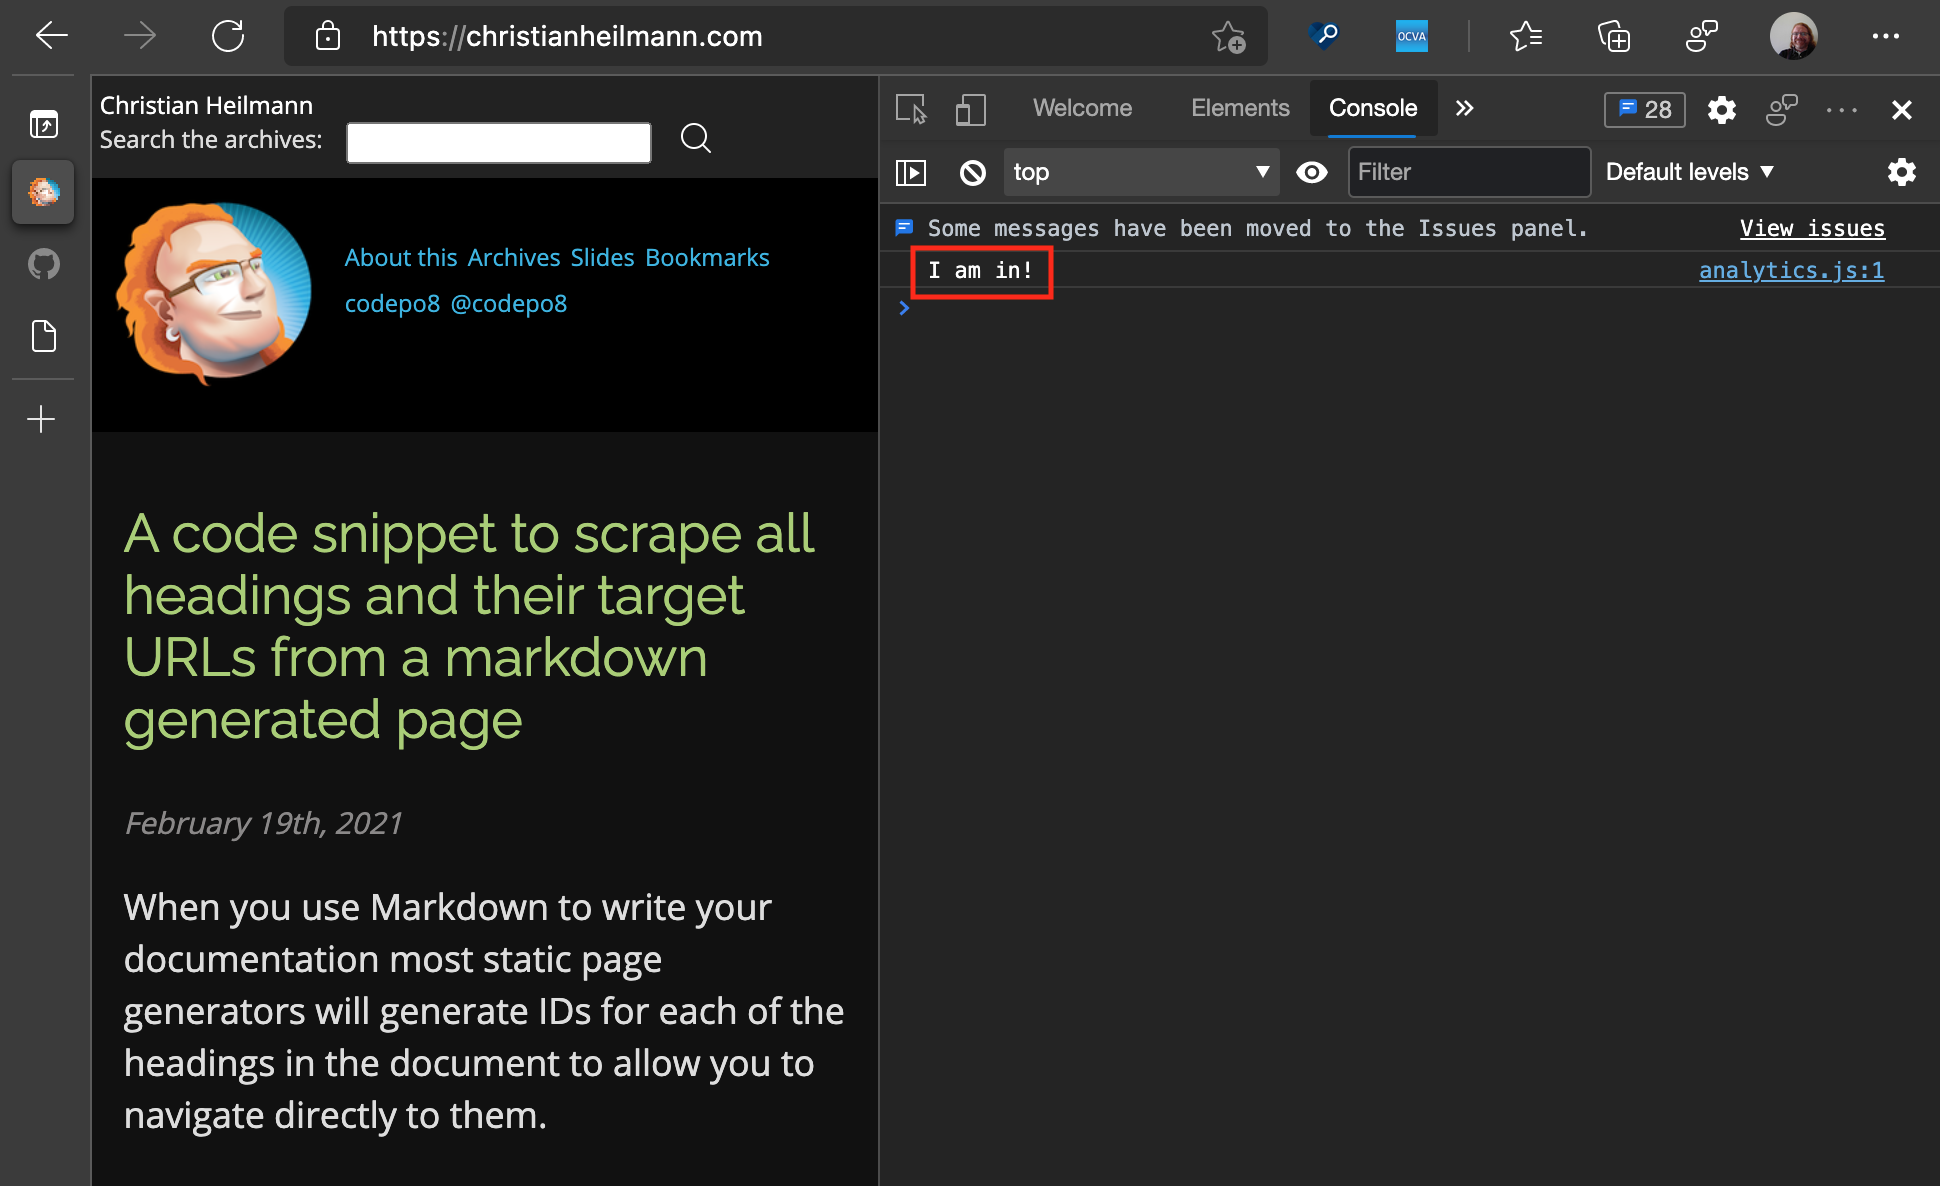
Next, you can select a file to override. Switch to the Page tab and go down to the www.google-analytics.com entry. Expand the section and you’ll find a analytics.js file. Click it to open it in the editor.
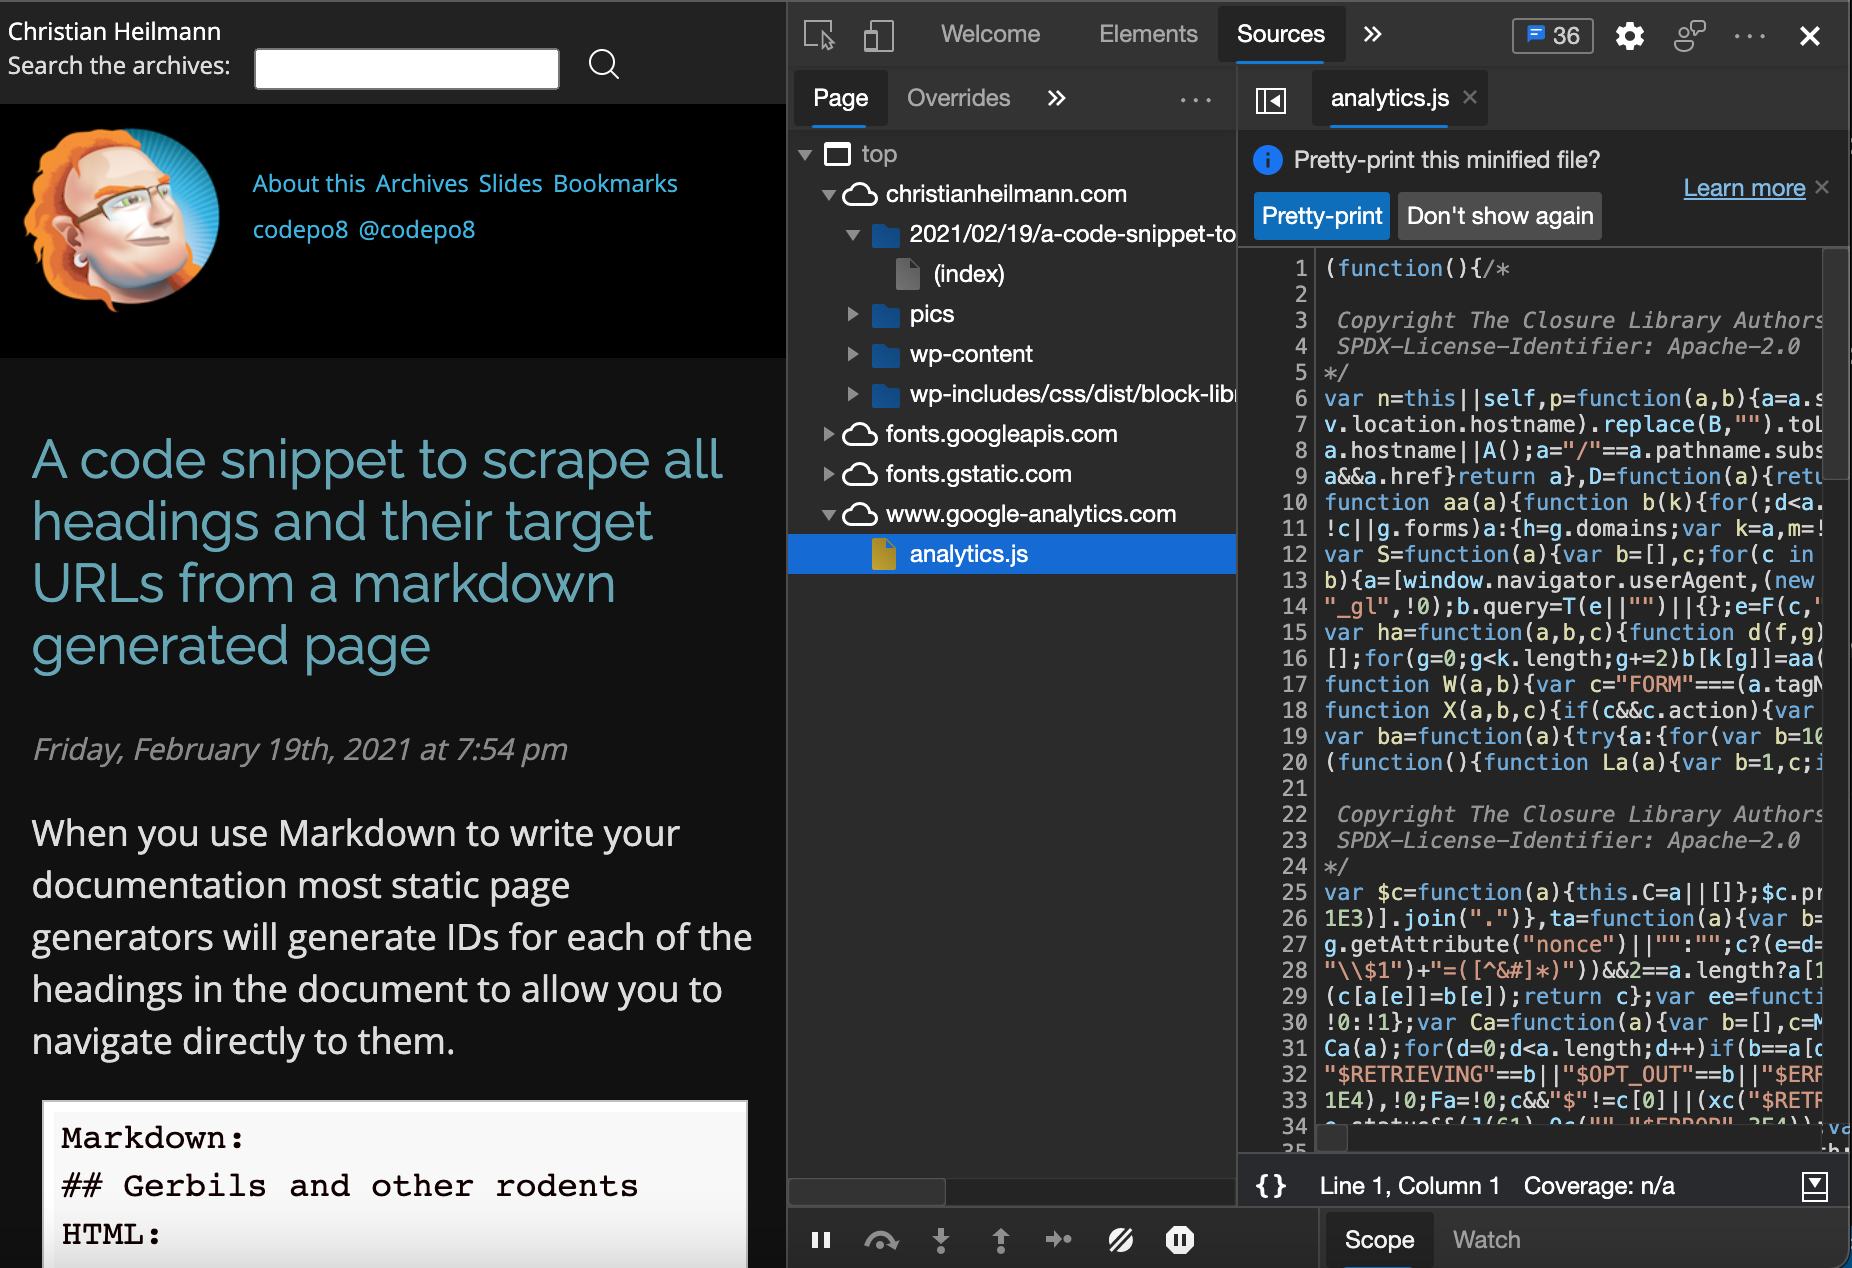
This also shows an interesting feature of the editor. It automatically detects when a file is minified and offers to pretty-print it to make it easier to read. You can do that with any file by activating the {} button on the bottom right.
For now, let’s just select all the code and replace it with a simple:
console.info('I am in!')
Once you’ve saved the file using CMD + s (macOS) or Ctrl + s (Windows, Linux), you’ll see a purple dot next to the file name. This shows you which files aren’t loaded from the source web site any longer but are coming from you hard drive instead.
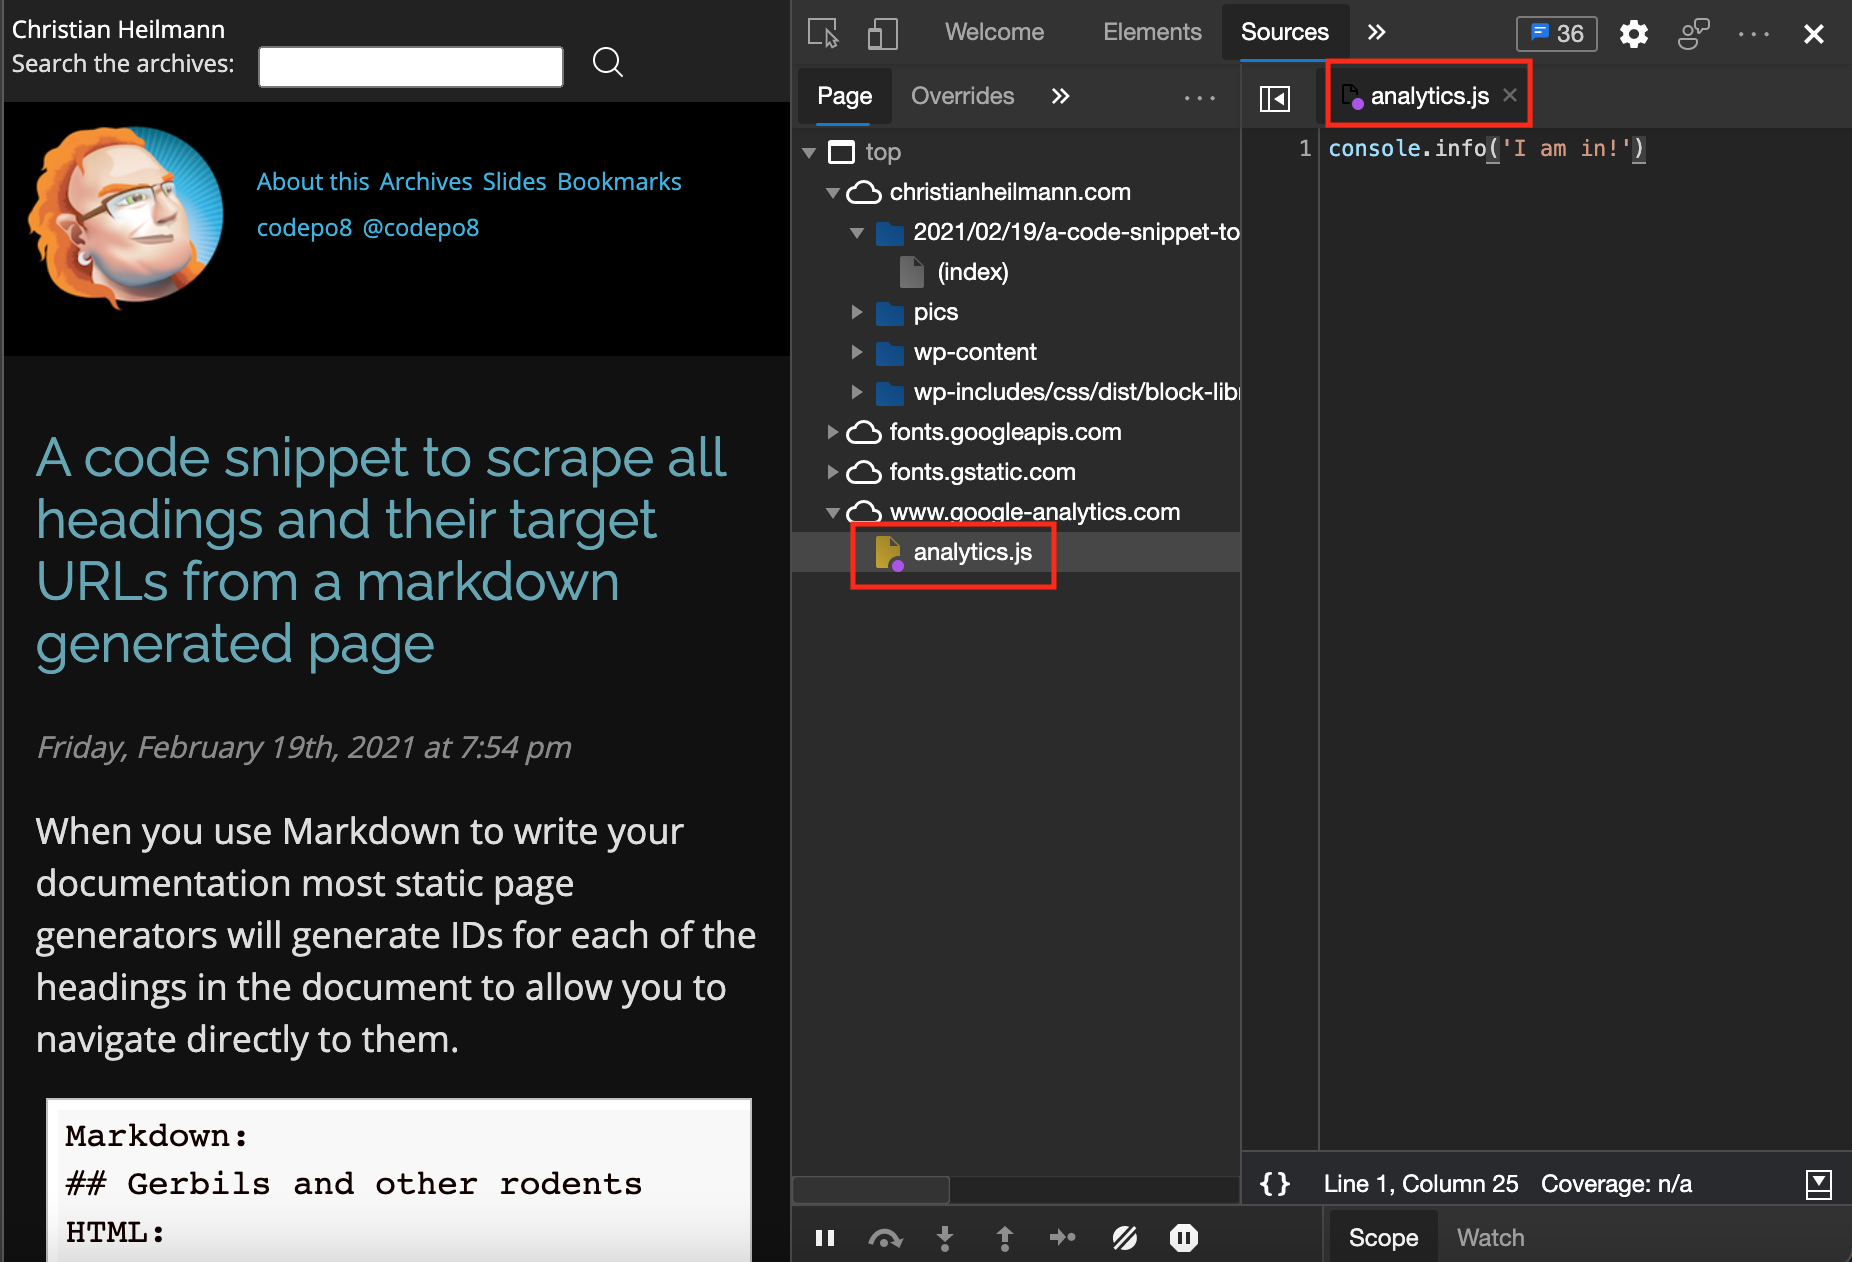
If you now navigate anywhere on christianheilmann.com, it won’t load the analytics file any longer, but will run the one from you hard drive instead. The console says “I am in”, and I never wrote that code.
If you now look into your local-overrides folder, you’ll find a www.google-analytics.com folder with the analytics.js file inside it. You can either edit the file in the developer tools, or directly in that folder with an editor of your choice. Any change to the file will be reflected in the other environment.
Sync Your Development and Debugging Tasks with Workspaces
When it comes to syncing, Workspaces are another feature that doesn’t seem to get enough usage. When we think back to our common development approach in the beginning of this article, we seem to develop in our editors and debug in the browser. This makes sense, but the bigger issue is how we get the things we changed back into our source code? Often we just tweak a few settings and then repeat the changes in our editor. There’s a better way.
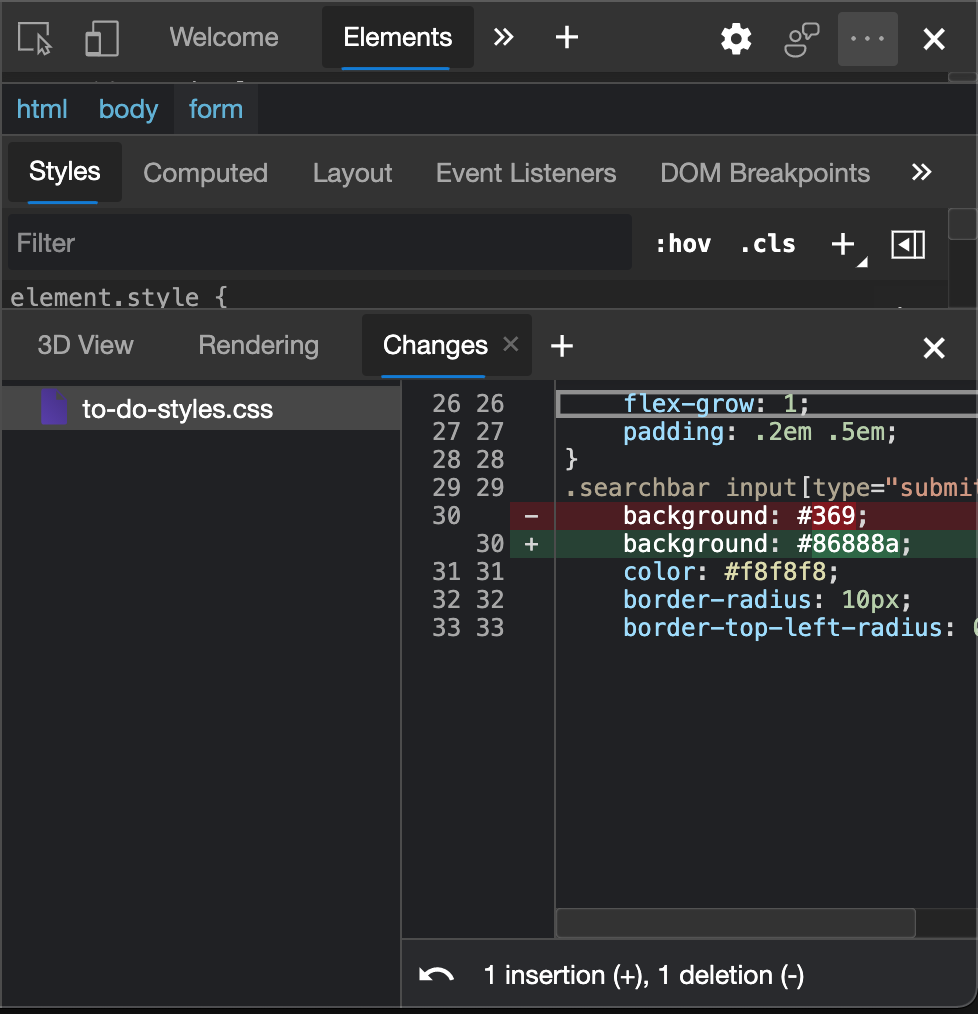
The first thing that may not be known to you yet is that there’s a Changes tool. Say, for example, you work on the small to-do list demo and you want to tweak the look and feel a bit. You’d normally do that in the Elements tool, as shown in the following GIF:
The common way to get this change back into your code would be to copy and paste the color code from the CSS and copy it back into the source code in you editor. But what about more changes? Developer tools also keep track of what you’ve changed, and if you go to the Changes tab, you get a list of all the files you changed and what changed in them. The easiest way to access this is to use the Command Menu again and type changes, which gives you the “Show Changes” option.
This makes it easier to track your changes, but it still feels weird to copy the changes back into your source code.
You can make the developer tools work with your editor by adding your project folder to a Workspace. To make this happen, go to the Sources tool and drag and drop your project folder onto it.
You once again have to give the developer tools permission to access this folder, much like we did in the overrides example earlier. Once you’ve done that, any change you make to the file in the developer tools will be synced. You can see this in the following GIF. On the left-hand side is my VS Code editor with the file open, and on the right is the browser. Changing the color in the Elements tool now not only updates it live in the browser, but also changes the code in my editor. None of the tweaking you do needs to get an extra copy and paste step.
Merging Developer Tools with the Editor: the Devtools for VS Code Extension
It seems a good idea to bring the power of a great editor and the inspection power of the browser developer tools together. This is why we created an extension for Visual Studio Code that does exactly that. If this is your editor of choice, you can install the Microsoft Edge Tools for VS Code extension and you get the developer tools right in your editor, complete with a fully functional browser. You can see what that looks like in the following GIF.
What’s Next?
I hope that, in reading this article, you’ve gotten some ideas about how to use your browser’s developer tool features beyond just adding a console.log() into your scripts. The next step for me, as a developer, was to move away from the console altogether and get accustomed to using breakpoint debugging. The benefits are that your code stops and you can inspect the changes that happen along the way instead of tracing back what happened once it was executed. It’s a different way of approaching the same problem and not as easy, but it’s well worth your time.
Frequently Asked Questions (FAQs) about Debugging Skills in JavaScript
What is the difference between console.log, console.info, console.warn, and console.error?
These are all methods of the console object that are used for logging information during the debugging process. Console.log is the most basic and simply outputs a message to the console. Console.info works similarly to console.log, but is used for informational messages. Console.warn outputs a warning message to the console, typically highlighted with a yellow background. Console.error is used to output error messages and is typically highlighted with a red background. The main difference between these methods is the type of message they output and how they visually represent it in the console.
How can I use console.table for debugging?
Console.table is a very useful method for displaying data in a tabular format in the console. It takes two arguments: data and columns. The data argument is an array or an object which will be displayed as a table. The columns argument is an optional array specifying the columns to be included in the table. This method can be particularly useful when dealing with large datasets, as it provides a clear and organized view of the data.
What is console.assert and how can I use it?
Console.assert is a method that writes an error message to the console if the assertion is false. If the assertion is true, nothing happens. This method is useful for testing and debugging, as it allows you to write tests directly in your code. The first argument is the assertion and the second argument is the message that will be displayed if the assertion is false.
How can I use console.group to organize my console output?
Console.group is a method that allows you to group related messages together in the console. This can be particularly useful when you have a lot of console output and want to keep it organized. To start a new group, simply call console.group(). Any console output after this call will be included in the group. To end the group, call console.groupEnd().
What is console.time and console.timeEnd and how can I use them for performance testing?
Console.time and console.timeEnd are methods that allow you to measure the time taken for a specific block of code to execute. This can be useful for performance testing and optimization. To start the timer, call console.time() with a unique identifier as the argument. To stop the timer and get the elapsed time, call console.timeEnd() with the same identifier.
How can I use console.trace to track the execution of my code?
Console.trace is a method that outputs a stack trace to the console. This can be useful for debugging, as it allows you to see the sequence of function calls that led to a specific point in your code. To use it, simply call console.trace() at the point in your code where you want to output the stack trace.
What is the difference between console.dir and console.log?
Console.dir and console.log are both methods of the console object used for logging information during the debugging process. The main difference between them is how they handle JavaScript objects. Console.log outputs the object in a string format, while console.dir outputs the object in a JSON-like tree structure, which can be expanded and inspected.
How can I use console.clear to clean up my console output?
Console.clear is a method that clears the console. This can be useful when you have a lot of console output and want to clean it up. To use it, simply call console.clear(). Note that this method does not affect the console history, so you can still navigate through previous commands and outputs using the up and down arrow keys.
What is console.count and how can I use it for debugging?
Console.count is a method that logs the number of times that it has been called with a specific label. This can be useful for debugging, as it allows you to count the number of times a particular part of your code is executed. To use it, simply call console.count() with a label as the argument.
How can I use console.debug for debugging?
Console.debug is a method that outputs a message to the console, similar to console.log. The main difference is that console.debug messages are only displayed when the console is in debug mode. This can be useful for outputting debug information that you don’t want to be displayed in the normal console output. To use it, simply call console.debug() with your message as the argument.
 Christian Heilmann
Chris Heilmann is a Senior Program Manager at Microsoft and literally wrote the handbook on developer evangelism. He spends a lot of time speaking at conferences, blogging and helping people understand and make others understand technology better. You can follow him on Twitter and read his blog.