Introduction to Dev Tools, v3

Jon Kuperman

Jon Kuperman

Cloudflare
3 hours, 22 minutes CC
Introduction to Dev Tools, v3

Course Description

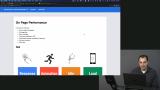
Go beyond console.log to master all the built-in tools available in Google's Chrome Developer Tools to edit, debug, and profile your web applications! You'll learn to step through your code with the debugger, audit web page performance on top of simulated network conditions. And remove "page jank" when a site isn't keeping up.

This course and others like it are available as part of our Frontend Masters video subscription.

Preview
Close

Course Details

Published: March 30, 2021

Learning Paths

Topics

Learn Straight from the Experts Who Shape the Modern Web

Your Path to Senior Developer and Beyond
  • 200+ In-depth courses
  • 18 Learning Paths
  • Industry Leading Experts
  • Live Interactive Workshops
Get Unlimited Access Now

Table of Contents

Introduction

Section Duration: 12 minutes
  • Introduction
    Jon Kuperman introduces the course, provides course materials including the GitHub repository, discusses the benefits of learning to use DevTools, and provides a course outline. Debugging, web performance, and insight into how other websites work are a few benefits discussed.
  • DevTools History
    Jon demonstrates how to inspect using DevTools, what is being displayed in the Elements tab, and how to view source code. The past process of checking for values and objects in source code and past tools used to help debug code.

Setup

Section Duration: 1 hour, 26 minutes

Network & User Performance

Section Duration: 1 hour, 35 minutes
  • Network Performance & Network Waterfall
    Jon discusses the importance of page load time and its effect on user traffic. Network terminology, filtering requests, inspecting packets, how to watch an app load with screenshots, simulating network conditions, emulating offline mode, and discussing the network waterfall are also covered in this segment.
  • Network Performance Q&A
    Jon answers students questions regarding the correlation between priority and waterfall, if TTFB and waiting are server side or front end issues, if the user's machine is taken into consideration, what the Initiator column contains, how to use the advanced search options, and displaying memory cache.
  • Measuring Real User Performance
    Jon discusses the history of measuring user performance by using getTime and console.time to measure the time it takes to send and receive data. The current method of using performance mark and measure from the performance API to see the actual loading time.
  • On-Page Performance
    Jon demonstrates how to read a flamegraph, find page jank, paint rectangles, check your applications FPS, find slow functions, and view web vitals. Discussing what scripting, rendering, and painting are is also covered in this segment.
  • Performance Panel & Page Jank Tips
    Jon discusses different rows in the Performance panel and demonstrates how improve performance by using requestAnimationFrame, web workers, frameworks, and reducing code complexity. Web workers can be invoked from any JavaScript file using the given code and creating a worker.js file.
  • Layout Thrashing Exercise
    Jon instructs students to generate enough images to cause page jank, run a performance recording, look for ways to quickly recognise page jank, and find what the optimize button does to help the site run faster.
  • Layout Thrashing Solution
    Jon live codes the solution to the Layout Thrashing exercise and answers a student's question about viewing the call stack.
  • Running Node.js
    Jon demonstrates how to run DevTools on a Node.js application by running an inspect flag in the terminal.
  • Memory Leaks & Memory Heap Snapshots
    Jon discusses how to recognise a JavaScript memory leak by using Chrome Task Manager, the Performance panel, and the Memory panel. The Chrome Task Manager is not part of the DevTools, but can be used to display JavaScript memory being used by Chrome tabs. A student's question regarding what to look for in the performance panel to recognise a memory leak is also covered.
  • What Can Slow Down a Website
    Jon discusses different problems that can slow down your website on both the back end and the front end. Back end issues include the database, server, network, and file compression. Front end issues include having large JavaScript bundles, too many files, images or JavaScript not being async, images are to large, uncompressed images, unused JavaScript or CSS, CSS in Document Body, and not using browser caching.
  • Simulating Network Conditions
    Jon demonstrates how to simulate different network speeds using the Network panel and CPU throttling on the Performance panel. Student questions regarding services that look for dead code,
  • Lighthouse Audits
    Jon demonstrates how to use Lighthouse to audit an application and discusses the meaning of the different scores generated. The metrics rated are performance, PWA, best practices, accessibility, SEO, and mobile and desktop performance.

Wrapping Up

Section Duration: 8 minutes
  • Wrapping Up
    Jon wraps up the course by discussing Puppeteer, Lighthouse CI, and how to enable Chrome DevTools experiments and addons including AXE and React. Links to continue learning about DevTools are also shared in this segment.

Learn Straight from the Experts Who Shape the Modern Web

  • In-depth Courses
  • Industry Leading Experts
  • Learning Paths
  • Live Interactive Workshops
Get Unlimited Access Now